Quantitative Backtesting: End-to-End ETL pipeline & Tableau Dashboard
This project delivers a complete, end-to-end quantitative analysis pipeline, demonstrating my ability to engineer data and derive financial insights at scale. I used the Alpaca Trade API to acquire three months of intraday and daily data for 15 stocks, processing over 800,000 records. For feature engineering, I employed Pandas and NumPy to calculate essential metrics like daily returns, annualized volatility, and multi-period moving averages.
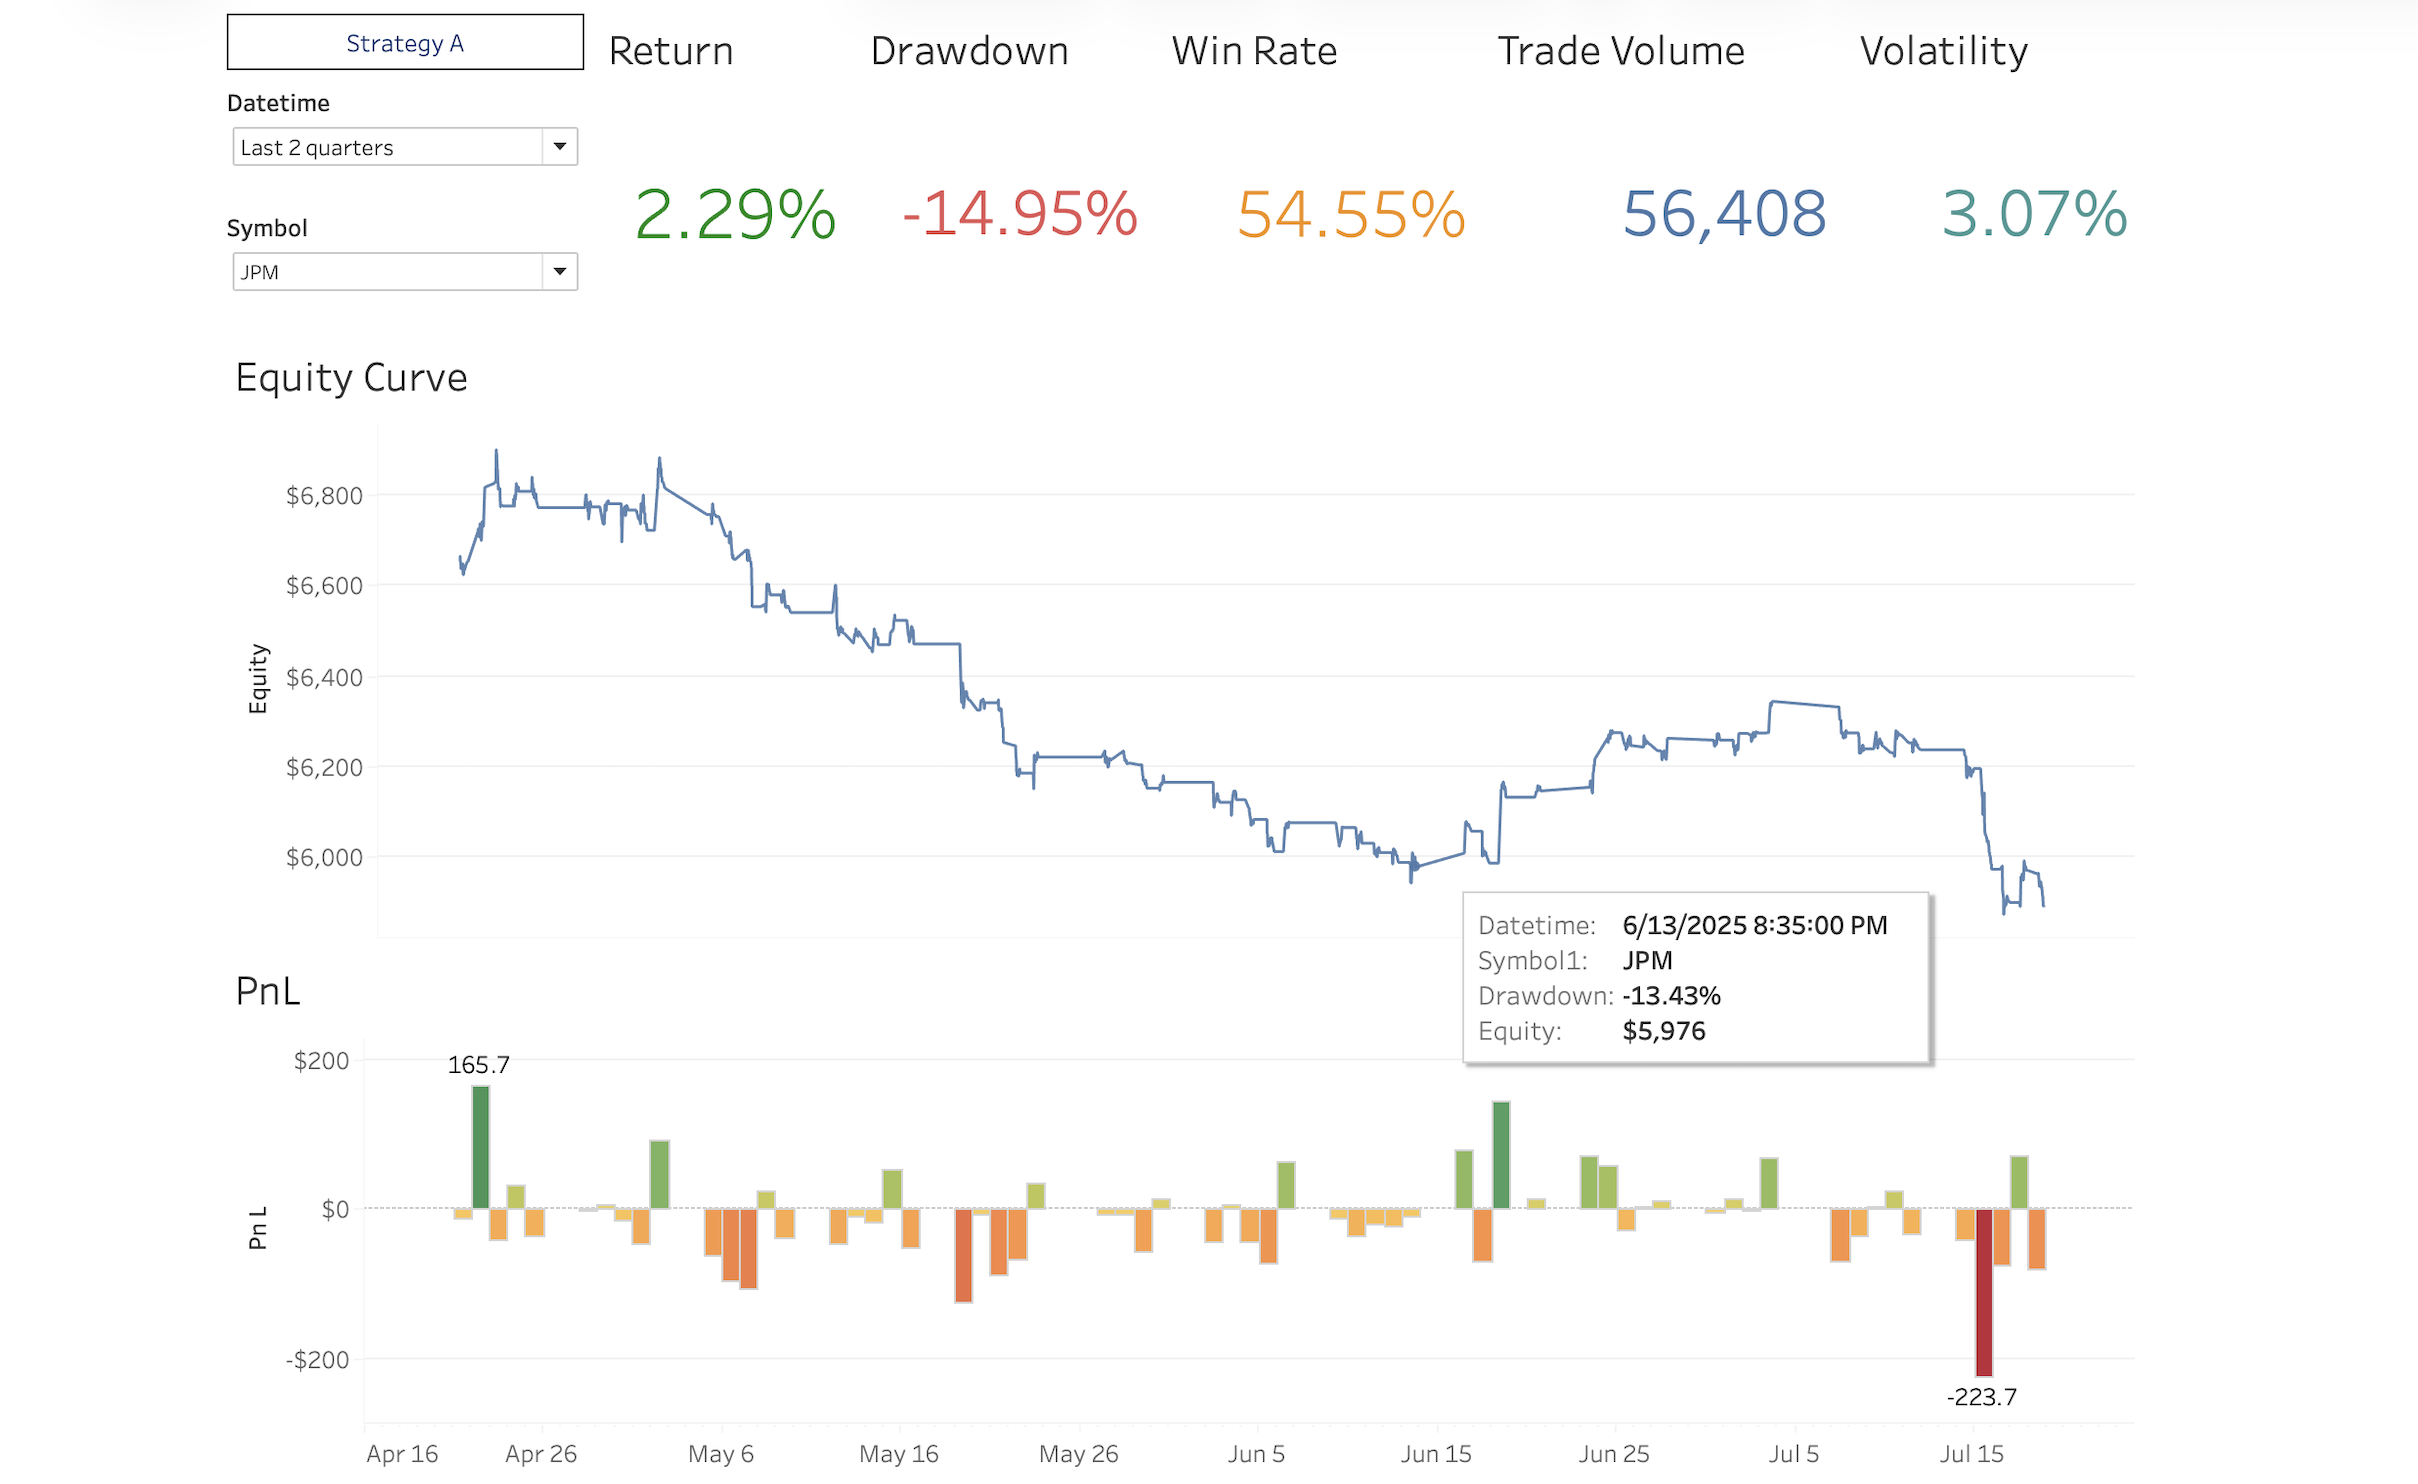
The core of the project is the backtesting of a dual moving average crossover strategy (5-minute vs. 20-minute MA). Assuming a 2% risk-free rate and $100k initial capital, I simulated trades, generated detailed logs, and evaluated performance using key metrics: annualized return, volatility, Sharpe ratio, and maximum drawdown. This quantitative assessment provides a clear picture of the strategy's risk-return profile.
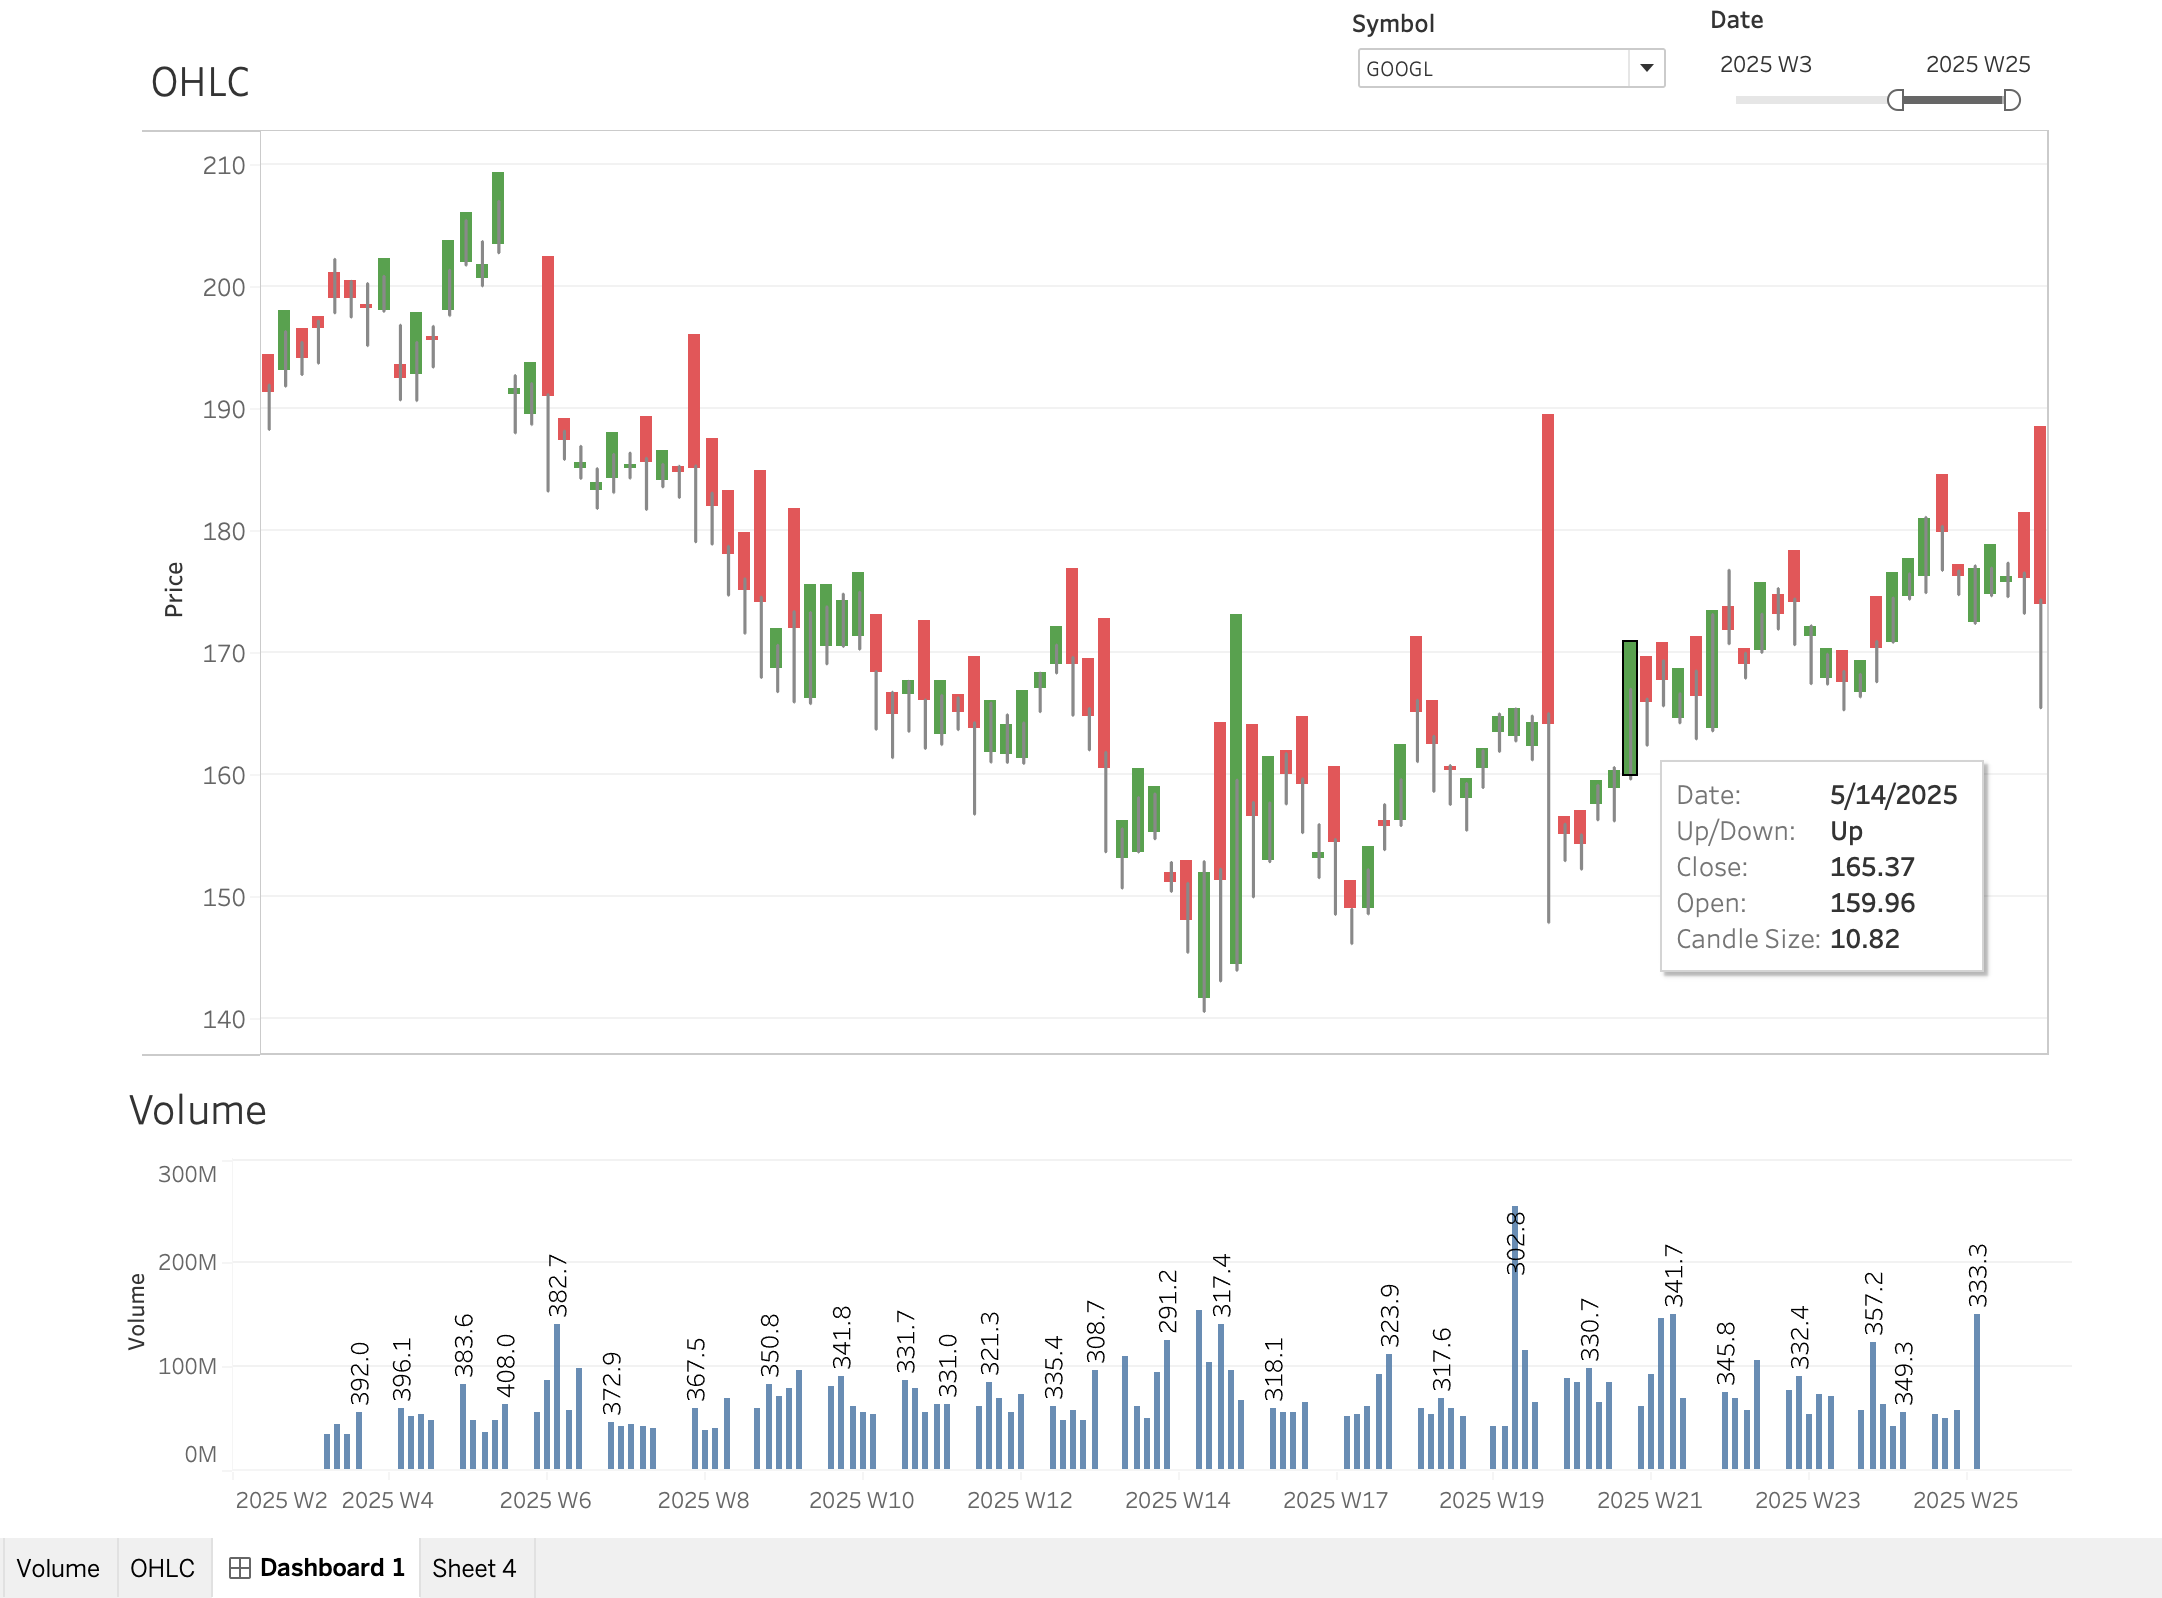
Finally, I built an interactive Tableau dashboard to visualize the results. It features a stock view for OHLC price and volume analysis, and a strategy view to explore the equity curve and P&L. This pipeline showcases my proficiency in integrating data engineering with quantitative finance to create actionable, data-driven insights.